
Fluorometry is an analytical method to measure the emitted fluorescent light. It is the emission of electromagnetic radiation when a specie absorbs exciting radiation from any outside source. The intensity of emitted light will be directly proportional to the concentration of the excited species. It is being widely used for automated immunoassays. It is almost 1000 times more sensitive than comparable techniques.
Introduction
Fluorescence and phosphorescence are the processes that occur when a molecule relaxes from its electronically excited state. Fluorescence spectroscopy is a technique in which sample molecules are excited with a photon source. Then these molecules relax and emit radiation. These radiations can be easily detected by measuring the intensity of that emission. These processes involve transitions between vibrational and electronic states of polyatomic fluorescent molecules, also called fluorophores.
Fluorophores play a central role in fluorescence spectroscopy. Fluorometry is preferred for its extraordinary sensitivity, simplicity, high specificity, and very low cost compared to other analytical techniques. It is a valuable analytical tool that is widely accepted for a variety of uses.
Fluorometry can be used in forensics, genetic analysis, environmental, industrial, medical diagnostics, DNA sequencing, and biotechnology applications. It is a powerful technique for both quantitative and qualitative analysis.
Definitions
Fluorescence: Fluorescence is when a molecule absorbs light at one wavelength and reemits at another longer wavelength.
Fluorophore: A fluorophore is an atom or molecule that fluoresces. Fluorophores contain aromatic rings like Tryptophan, Tyrosine, Fluorescein, etc.
Fluorometer: A fluorometer is an instrument to detect and measure fluorescence.
What is Fluorometry?
Fluorometry is the measurement of emitted fluorescent light. Fluorometry is an analytical method to detect and measure fluorescence in compounds like proteins, cells, or nucleotides. It utilizes ultraviolet light to excite the sample. It sees the fluorescence in the exciting sample that emits when this sample returns to its ground state.
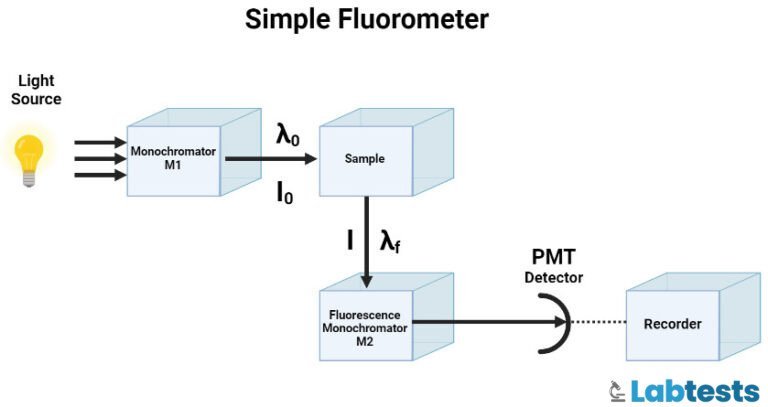
Principle of fluorescence spectroscopy
UV or visible radiation is absorbed, which leads to the transition of electrons from the singlet ground state to the singlet excited state. This new excited state is not stable and returns to a singlet ground state by emitting energy in the form of visible radiation or UV light.
Fluorescence emission occurs as the molecules or atoms that fluoresce decay from the singlet electronic excited states to an allowable vibrational level in the electronic ground state. The fluorescence excitation and emission spectra reflect the vibrational level structures in both the ground and the excited states.
Types of fluorometers and spectrofluorometers
- Ratio-referencing spectrofluorometers
- Time-resolved fluorometers
- Flow cytometer
- Hematofluorometer
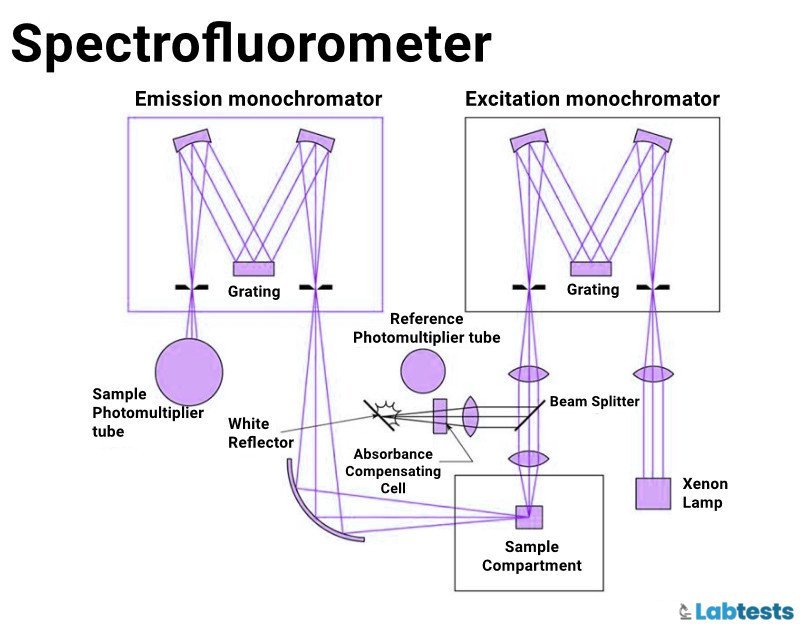
Ratio-referencing spectrofluorometers
The ratio-referencing spectrofluorometers split the energy from the light source. The instability of energy sources affects the sample PMT and reference and reduces the possibility of measurement error. This type of spectrofluorometer is used to measure a given compound’s excitation or emission spectrum.
Time-resolved fluorometer
It is similar to the ratio-referencing spectrofluorometer, but the time-resolved fluorometer’s light source is pulsed. It uses long-lived fluorophores like lanthanide, metal ions europium, and samarium.
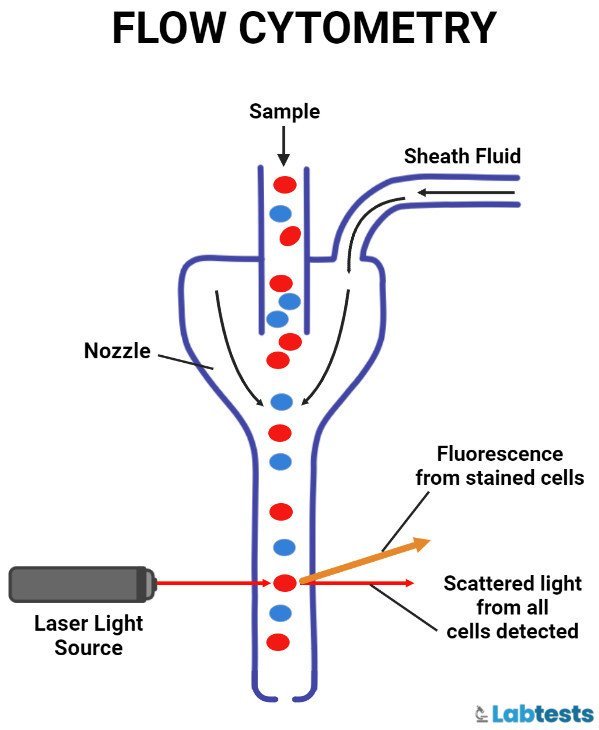
Flow cytometer
Flow cytometry is a process to measure the physical and/or chemical characteristics of cells, or by extension, of other biological particles, and the measurements are taken when these particles pass in a fluid stream.
Hematofluorometer
It is a single-channeled, front-surfaced photofluorometer used to analyze the zinc protoporphyrin in the whole blood. A drop of whole blood is placed at a cuvet. The analysis of zinc protoporphyrin is used for lead screening in adults and iron deficiency in pediatric populations.
Instrumentation
- Fluorometers
- Spectrofluorometers
- Glass Filters used by fluorometers
- Interference filters used by fluorometers
- Prisms are used to produce monochromatic light for the excitation of samples and the isolation of fluorescence emissions.
Components
The basic components of fluorometers and spectrofluorometers are
- Excitation source
- Excitation and emission monochromator
- Cuvet
- Detector
Excitation source
An intense lamp cable that can emit radiant energy is required as the excitation source. Excitation sources most commonly used are Xenon lamps, Mercury arc lamps, Quartz halogen lamps, and lasers.
Excitation and emission monochromator
Monochromators used in fluorescence are interference filters, gratings, colored glass filters, and prisms. Colored glass filters selectively absorb certain wavelengths.
Cuvet
These are used to hold the liquid sample to be analyzed. These are usually square or rectangular and made of glass, plastic, or quartz. Some cuvets contain UV absorbers that cause unwanted background signals and losses sensitivity.
Photodetectors
The devices used as photodetectors are PMT and CCD (charge-coupled detector).
Factors affecting fluorescence
Temperature
- An increase in temperature increases collisions of molecules and decreases fluorescence intensity. In contrast, a decrease in temperature causes a reduction in collisions of molecules and increases fluorescence intensity.
Oxygen
- Oxygen decreases fluorescence intensity. It oxidizes fluorescence substances into non-fluorescents.
Nature of substituent groups
- Electron-donating groups enhance fluorescence activity, i.e amino, and hydroxyl groups.
- Electron withdrawing groups reduce fluorescence, i.e. Nitro, the carboxylic group.
- Some groups, like SO3H or NH4+, do not affect fluorescence intensity.
The rigidity of structures
- Rigid structures will produce more fluorescence than flexible structures.
pH
- a) Aniline: Neutral or alkaline medium have visible fluorescence while acidic conditions only give fluorescence in the UV region.
- b) Phenols: Acidic conditions will not have fluorescence, while alkaline conditions have.
Viscosity
- An increase in viscosity causes decreased collisions of molecules and enhances fluorescence intensity, while a decrease in viscosity causes increased collisions of molecules and reduces fluorescence intensity.
Limitations
- This technique is less applicable because all compounds and elements cannot show fluorescence.
- Traces of nitrogen oxides and iodide are efficient quenchers, and they can interfere.
- Careful buffering is required as fluorescence intensity may be strongly dependent upon UV light used for excitation purposes, and it may cause the destruction of the fluorescent molecule or photochemical changes.
- This method is also unsuitable for determining the major constituents of a sample because the accuracy is significantly less for large amounts.
- The presence of dissolved oxygen may increase photochemical destruction.
Limitations
- Careful buffering is required as fluorescence intensity may be strongly dependent upon Ultraviolet light used for excitation purposes, and it may cause photochemical changes or destruction of the fluorescent molecule.
- The presence of dissolved oxygen may increase photochemical destruction.
- Traces of iodide and nitrogen oxides are efficient quenchers, and they can interfere.
- This method is also unsuitable for determining major constituents of a sample because the accuracy is significantly less for large amounts.
- This technique is less applicable because all elements and compounds cannot show fluorescence.
Precautions
- Don’t expose the solution to ultraviolet radiation for more extended periods.
- Grease from stop cocks is a contaminant.
- Filter paper also has fluorescent material and is extracted by solvents.
- The sample should be free from contamination as it is used for trace substances.
- Show the concentration of the reagent in micro molecules so that the ratio of the reagent to metal can be estimated easily.
- Rubber and cork stoppers have fluorescent materials and are extracted if the solvent touches them.
- It’s important to avoid large temperature changes between unknown and standard.
- All glasses have Ca, Al, and SiO2, which may be extracted.
Applications
- Investigation of chemical structures and processes: These are used for investigating hydrogen bonding, cis-trans isomerism polymerization, tautomerism and rates of reactions, etc. We can detect free radicles with a spectrograph.
- Chemical analysis: We can do quantitative as well as qualitative analysis.
- Laser-induced fluorescence spectroscopy for the diagnosis of tumor: Cancer is one of the most dreaded medical conditions. Laser spectroscopic techniques have the potential for in-situ, near-real-time diagnosis of carcinoma.
- Study of marine petroleum pollutants: Fluorescence spectroscopy detects oil slicks on the water surface. It also determines petroleum contaminants in seawater and particular petroleum derivative compounds, as well as identifies pollution sources.
- Accurate determination of glucose: Glucose is a major component of animal and plant carbohydrates in biological systems and is also an indicator of human health conditions such as diabetes or hypoglycemia.
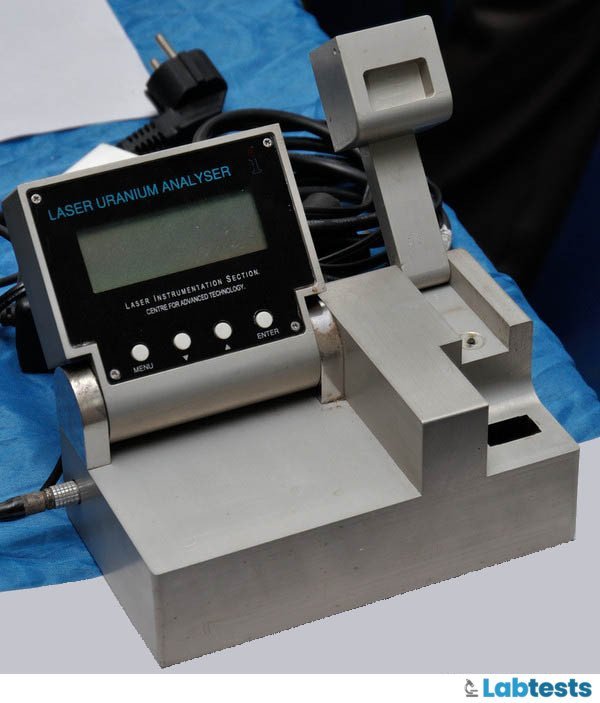
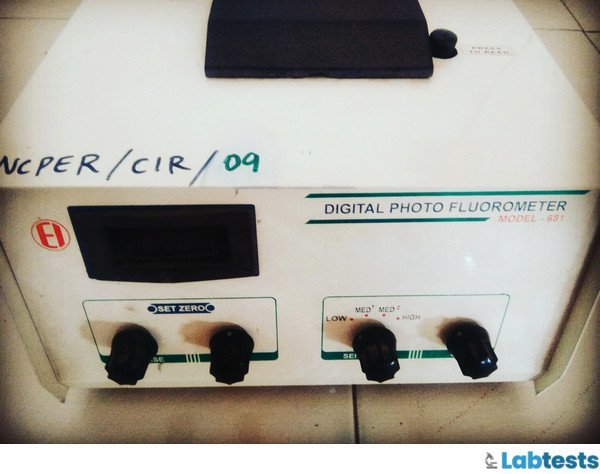
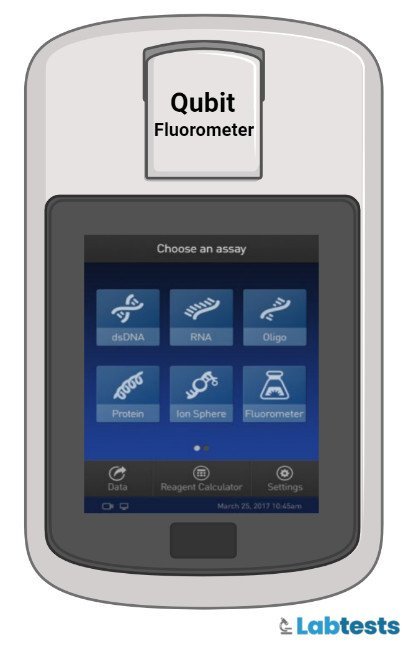
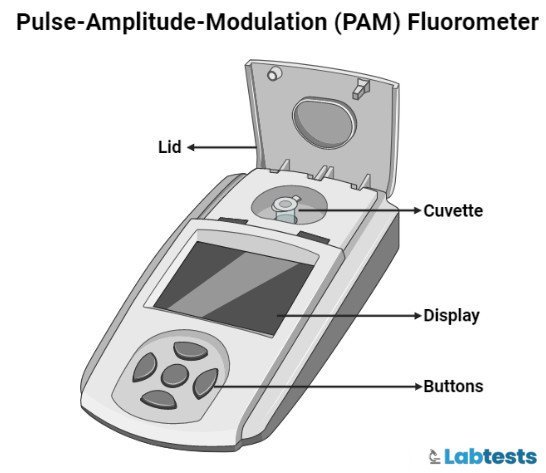
Fluorometer Pictures and Diagrams
Frequently asked questions
Q1. What does Fluorometry measure?
Fluorometers measure fluorescence. Fluorescence is emitted when the light of a specific wavelength in a sample excites electrons and these electrons fluoresce light of a different wavelength.
Q2. What light is used for fluorescence?
The light used for fluorescence can be of one of three types
1) Broadband sources like mercury-arc and tungsten-halogen lamps.
2) Laser excitation sources offer more selective illumination by one or a few well-defined peaks.
3) High-output light-emitting diodes, or LEDs, have selective wavelengths, low cost, less energy consumption, and a long lifetime.
Q3. Which vitamins can be detected by fluorescence?
Vitamin B12 and thiamine in pharmaceutical preparations are detected by the fluorimetric method.
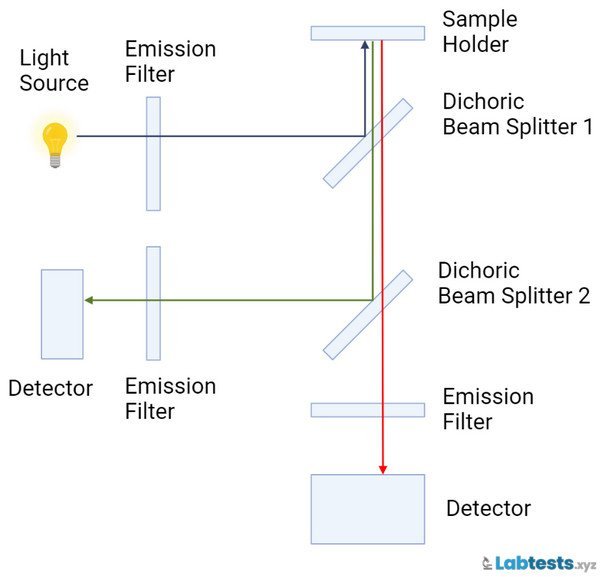
Q4. How many filters are used in fluorimetry?
Two filters are used in the fluorometric method. The primary filter also called the excitation filter or incident light filter works by isolating the wavelength that will cause the compound to fluoresce. The secondary filter works by isolating the desired emitted light.
Q5. Does fluorescence require UV light?
The process of fluorescence only happens in the presence of UV radiation.
References
- Tietz Textbook of Clinical Chemistry and Molecular Diagnostics – 6th Edition. (2017, January 16). Retrieved October 21, 2022, from https://www.elsevier.com/books/tietz-textbook-of-clinical-chemistry-and-molecular-diagnostics/rifai/978-0-323-35921-4
- Dr.S. Ravishankar, Text book of pharmaceutical analysis: Flurimetry, edition 4, page no:3-18
- BK Sharma, Instrumental methods of chemical analysis, Molecular fluorescence spectroscopy [2011] page no: S537-S568.
- AH Beckett, JB Stenlake, Practical pharmaceutical chemistry, spectrofluorometry, part 2, edition: 4, page no: 367.
- Kommu Naresh, Applications of Fluorescence spectroscopy, Journal of Chemical and Pharmaceutical sciences, [2014], page no: 18-21.
- Douglas A Skoog, Donald M west, F James holler, Stanley R crouch, Molecular fluorescence spectroscopy , Textbook of Fundamentals of analytical chemistry,edition:8, page no:826-838 .
- Devala Rao, In practical pharmaceutical analysis, Estimation of quinine sulphate by fluorimetry, page no: 122.
- Arthus, Vogel, Text book of quantitative analysis ,page no;855
- Chris Maragos. Fluorescence Polarisation Immunoassay of Mycotoxins, A Review, Journal of Toxins, [2009]. Page no: 196-207.
