The Significance of Diabetes Chart
People with diabetes test their blood glucose at home using glucose monitors many times a day, and eventually, come to understand how to read, interpret, and realize the significance these readings.
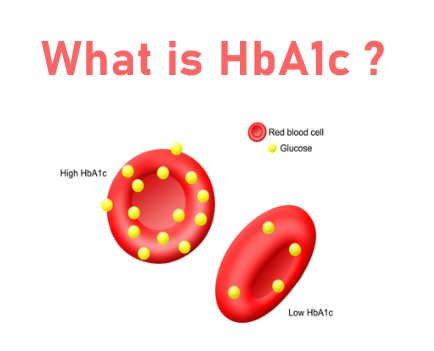
However, lab tests performed on a quarterly basis are often less understood. This holds true, especially in interpreting the results of HbA1c, especially since it is a better indicator of how well the patient is coping with diabetes, and how well is blood sugar controlled.
So this article is about the correlation between HbA1c (NGSP1 in %) and estimated Average Glucose (eAG) level (in mg/dl and mmol/l)
Daily testing of blood glucose is affected by many factors and such should be thoroughly considered. The HbA1c reading indicates the average condition of the patient for a three-month period. Hence, it is necessary for people with diabetes to deeply understand both laboratory results and the readings taken at home.
The chart indicates the context of a blood glucose reading from a home monitor. The chart also makes it easier for diabetics to interpret results and demonstrates how small increases in HbA1c reading can affect the patient’s overall health.
For instance, if the blood glucose reading moves from 6.3 to 7.6 in HbA1c reading is similar to that of the reading of 134 mg/dl to 171 using a home monitor.
In the below table the values mentioned are your average blood sugar levels during the past 2 to 3 months:
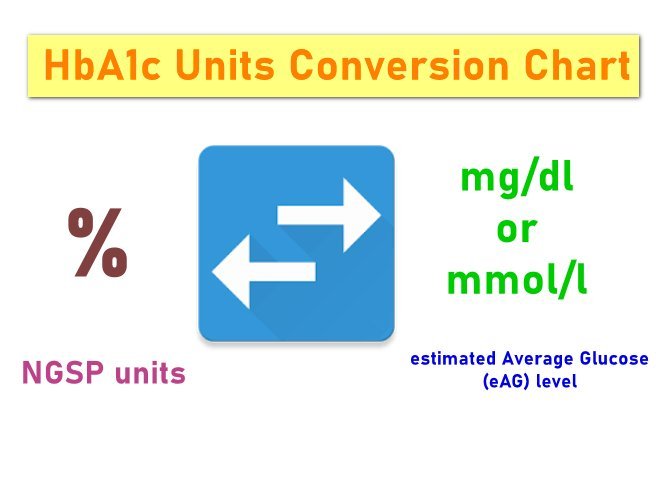
HbA1c Units Converter Chart Percentages (%) to estimated Average Glucose eAG – (mg/dl) or (mmol/l)
| If your A1C level is in (%) | If you live in the USA, use these values Your Blood Sugar is measured in milligrams/deciliter (mg/dL) | If you live outside the USA, use these values. Your blood sugar is measured in millimole/liter (mmol/L) |
|---|---|---|
| 4.0 | 68 | 3.8 |
| 4.1 | 71 | 3.9 |
| 4.2 | 74 | 4.1 |
| 4.3 | 77 | 4.2 |
| 4.4 | 80 | 4.4 |
| 4.5 | 82 | 4.6 |
| 4.6 | 85 | 4.7 |
| 4.7 | 88 | 4.9 |
| 4.8 | 91 | 5.0 |
| 4.9 | 94 | 5.2 |
| 5.0 | 97 | 5.4 |
| 5.1 | 100 | 5.5 |
| 5.2 | 103 | 5.7 |
| 5.3 | 105 | 5.8 |
| 5.4 | 108 | 6.0 |
| 5.5 | 111 | 6.2 |
| 5.6 | 114 | 6.3 |
| 5.7 | 117 | 6.5 |
| 5.8 | 120 | 6.6 |
| 5.9 | 123 | 6.8 |
| 6.0 | 125 | 6.9 |
| 6.1 | 128 | 7.1 |
| 6.2 | 131 | 7.3 |
| 6.3 | 134 | 7.4 |
| 6.4 | 137 | 7.6 |
| 6.5 | 140 | 7.7 |
| 6.6 | 143 | 7.9 |
| 6.7 | 146 | 8.1 |
| 6.8 | 148 | 8.2 |
| 6.9 | 151 | 8.4 |
| 7.0 | 154 | 8.5 |
| 7.1 | 157 | 8.7 |
| 7.2 | 160 | 8.9 |
| 7.3 | 163 | 9.0 |
| 7.4 | 166 | 9.2 |
| 7.5 | 169 | 9.3 |
| 7.6 | 171 | 9.5 |
| 7.7 | 174 | 9.7 |
| 7.8 | 177 | 9.8 |
| 7.9 | 180 | 10.0 |
| 8.0 | 183 | 10.1 |
| 8.1 | 186 | 10.3 |
| 8.2 | 189 | 10.4 |
| 8.3 | 192 | 10.6 |
| 8.4 | 194 | 10.8 |
| 8.5 | 197 | 10.9 |
| 8.6 | 200 | 11.1 |
| 8.7 | 203 | 11.2 |
| 8.8 | 206 | 11.4 |
| 8.9 | 209 | 11.6 |
| 9.0 | 212 | 11.7 |
| 9.1 | 214 | 11.9 |
| 9.2 | 217 | 12.0 |
| 9.3 | 220 | 12.2 |
| 9.4 | 223 | 12.4 |
| 9.5 | 226 | 12.5 |
| 9.6 | 229 | 12.7 |
| 9.7 | 232 | 12.8 |
| 9.8 | 235 | 13.0 |
| 9.9 | 237 | 13.2 |
| 10.0 | 240 | 13.3 |
| 10.1 | 243 | 13.5 |
| 10.2 | 246 | 13.6 |
| 10.3 | 249 | 13.8 |
| 10.4 | 252 | 13.9 |
| 10.5 | 255 | 14.1 |
| 10.6 | 258 | 14.3 |
| 10.7 | 260 | 14.4 |
| 10.8 | 263 | 14.6 |
| 10.9 | 266 | 14.7 |
| 11.0 | 269 | 14.9 |
| 11.1 | 272 | 15.1 |
| 11.2 | 275 | 15.2 |
| 11.3 | 278 | 15.4 |
| 11.4 | 280 | 15.5 |
| 11.5 | 283 | 15.7 |
| 11.6 | 286 | 15.9 |
| 11.7 | 289 | 16 |
| 11.8 | 292 | 16.2 |
| 11.9 | 295 | 16.3 |
| 12.0 | 298 | 16.5 |
| 12.1 | 301 | 16.6 |
| 12.2 | 303 | 16.8 |
| 12.3 | 306 | 17.0 |
| 12.4 | 309 | 17.1 |
| 12.5 | 312 | 17.3 |
| 12.6 | 315 | 17.4 |
| 12.7 | 318 | 17.6 |
| 12.8 | 321 | 17.8 |
| 12.9 | 324 | 17.9 |
| 13.0 | 326 | 18.1 |
| 13.1 | 329 | 18.2 |
| 13.2 | 332 | 18.4 |
| 13.3 | 335 | 18.6 |
| 13.4 | 338 | 18.7 |
| 13.5 | 341 | 18.9 |
| 13.6 | 344 | 19.0 |
| 13.7 | 346 | 19.2 |
| 13.8 | 349 | 19.4 |
| 13.9 | 352 | 19.5 |
| 14.0 | 355 | 19.7 |
International Federation of Clinical Chemistry (IFCC)1
National Glycohemoglobin Standardization Programme (NGSP)2